
The Impact of Renewable Energy and Economic Complexity on Carbon Emissions in BRICS Countries under the EKC Scheme


1
Polytechnic Institute of Santarém, Center for Advanced Studies in Management and Economics, Évora University, 700-812 Évora, Portugal
2
Center for African and Development Studies, Lisbon University, 1200-781 Lisbon, Portugal
3
Department of Political Economy and Public Finance, Economic and Business Statistics and Economic Policy, University of Castilla-La Mancha, 16002 Cuenca, Spain
4
Department of Political Economy and Public Finance, Economic and Business Statistics and Economic Policy, University of Castilla-La Mancha, 45002 Toledo, Spain
*
Author to whom correspondence should be addressed.
Energies 2021, 14(16), 4908; https://doi.org/10.3390/en14164908
Submission received: 5 July 2021
/
Revised: 28 July 2021
/
Accepted: 30 July 2021
/
Published: 11 August 2021
(This article belongs to the Special Issue Green Energy, Genuine Saving Growth, Sustainable Development and Climate Change)
Abstract
:Economic complexity makes it possible to assess the development of the countries, the relations of innovation, and the differentiation of products. The article considers the links between the hypotheses of the Kuznets environmental curve and economic complexity using panel data for the group of BRICS countries (Brazil, Russia, India, China, and South Africa) from 1990 to 2015. As an econometric strategy, this study considered the panel fully modified least squares (FMOLS), panel dynamic least squares (DOLS), fixed effects (FE), and Panel Quantile Regression. The empirical results showed that economic complexity, income per capita, renewable energy, and carbon dioxide emissions are integrated with the first difference when applying the unit root test. The arguments of Pedroni and Kao cointegration tests were also used. According to these results, the variables used in this research are cointegrated in the long run. The results validated the arguments of the EKC hypothesis, i.e., the income per capita and squared income per capita are positively and negatively correlated with CO2 emissions. Moreover, economic complexity and renewable energy aim to improve environmental damage and climate change.
1. Introduction
The studies by Santana et al. [1], Azevedo et al. [2], Khattak et al. [3], Ummalla and Goyari [4] assess an environmental Kuznets curve (EKC) for Brazil, Russia, India, China, and South Africa (BRICS), but it is noted that they did not introduce the impact of economic complexity on carbon dioxide emissions. In this context, we observed a gap in the literature about the relationship between economic complexity and CO2 emissions as applied to the BRICS group of countries.
The empirical study of Can and Gozgor [5] was one of the first contributions in the literature review about the link between economic complexity and climate change.
The literature review demonstrated that the economic complexity index aims to decrease pollution emissions and improve the quality of the environment (e.g., Dogan et al. [6], Chu [7], Romero and Gramkow [8], and Boleti et al. [9]).
Several authors have demonstrated that the Kyoto Protocol, the Paris Agreement, and the EU Agenda promoted studies that assessed the impact of renewable energies on carbon dioxide emissions (e.g., Leitão [10], Leitão and Balogh [11], Koengkan et al. [12], Balsalobre-Lorente et al. [13]).
The motivation of this article is related to the fact that we study a group of emerging countries, the BRICS, with considerable growth rates in the world economy. The report produced by Goldman Sachs [14], directed by economist Jim O’Neil, reported the importance of these economies, emphasizing China. However, Brazil and Russia had not such high growth rates when compared to China. The BRIC arises from a diplomatic agreement between countries, i.e., there is no formal trade agreement. In 2011, South Africa turned to join this group of countries, being designated in the literature the anachronistic BRICS. Over the last two decades, the growth trajectory has been rising, especially in BRICS countries. However, this economic growth occurs with a trade-off, which translates to a damaging effect on the environment. Numerous studies contemplate that the BRICS have the potential to position themselves economically and technologically as world leaders (Azevedo et al. [2]). In consequence, BRICS present higher levels of economic development, which leads them to encourage environmental regulations and structural changes towards a cleaner industrial and tertiarization economy.
This article explores the relationships between economic complexity, renewable energy, economic growth, and environmental Kuznets curve applied for BRICS countries for the period 1990–2015. Considering the recent literature (Leitão [10], Koengkan et al. [12], Balsalobre-Lorente et al. [13], Ike et al. [15]), we use panel data econometric techniques (the panel fully modified least-squares-FMOLS, panel dynamic least squares-DOLS, fixed effects -FE, and Panel Quantile Regression).
The main objective is to evaluate the relationships between economic complexity, renewable energies, economic growth, and carbon dioxide emissions, which underlie the assumptions of the environmental Kuznets curve. As such, we present a recent literature review to support both the methodology to be applied and the analysis of results and discussion. Finally, the article shows some conclusions that could serve as recommendations for economic policymakers.
2. Literature Review and Empirical Studies
In this section, we present a survey of recent literature review that explains the nexus between economic complexity, renewable energy, and CO2 emissions. The arguments of environmental Kuznets are also considered.
Recently, Hidalgo [16] explained and revisited the link between economic complexity theory and its application. The author suggests that economic complexity is associated with economic geography, international economics, economic development, and innovation.
According to Zhu and Li [17], Hidalgo and Hausman [18], Felipe [19], Dogan et al. [6], the economic complexity describes the level of development of countries in the relationship of innovation and product differentiation exports (higher or lower quality of products).
Based on the contributions of Can and Gozgor [5], Hidalgo and Hausman [18], and Sweet and Maggio [20], we observe that the index of economic complexity reflects the endowments of production, or country’s production capacity (Zhu and Li [17], Felipe [19]). In this context, international economics and the classic and neoclassic trade theory revealed comparative advantages (Heckscher–Ohlin theorem), showing that countries can be capital or labor abundant, and the sector or the product capital or labor-intensive.
Researchers introduced new factors explaining climate change in the last years. For example, the nexus of corruption, democracy, globalization, and economic complexity on economic growth or environmental damage has been quite frequent as a study subject at energy economics. In this context, there exist empirical studies such as Can and Gozgor [5], Dogan et al. [6], Chu [7], Romero and Gramkow [8], and Boleti et al. [9] that analyses the effect of economic complexity on carbon dioxide emissions, using the argument of environment Kuznets curve (EKC), considering different econometric models. These studies concluded that economic complexity allows decreasing carbon emissions.
The empirical study of Can and Gozgor [5] using a DOLS–Dynamic Ordinary Least Squares estimator for the France experience demonstrated that income per capita and squared income per capita are according to EKC hypotheses. The authors also found a negative correlation between economic complexity and carbon dioxide emissions. Furthermore, the variable of energy consumption presents a positive impact on pollution emissions.
The relationship between economic complexity, renewable energy, and CO2 emissions to 28 countries of OECD for the period 1990–2014 was investigated by Dogan et al. [6]. The authors used as explanatory variables economic complexity, renewable energy, population, and income per capita. Considering panel data FMOLS–Fully Modified Least Squares, DOLS–Dynamic Ordinary Least Squares, and ARDL–Autoregressive Lag Distribution, the econometric results reveal that population and income per capita are positively correlated with carbon dioxide emissions. Moreover, renewable energy and economic complexity variables negatively affect CO2 emissions, showing that renewable energy and economic complexity encourage environmental improvements.
The nexus between economic structure, economic complexity, and ECK hypothesis was investigated by Chu [7]. The author applied a dynamic panel data (GMM-System estimator) considering 118 countries for the period 2002–2014. The econometric results show that the lagged variable of carbon dioxide emissions presents an increase in the long run. Nevertheless, the economic complexity index and squared economic complexity present a nonlinear effect on carbon dioxide emissions.
The role of oil production and EKC assumptions was investigated by Ike et al. [15]. Considering 15 oil-producing countries for the period 1980–2010, the authors used as econometric strategy panel cointegration estimation and panel quantile regression. In general, the estimates present by panel quantile regression demonstrated that income per capita and squared income per capita found support on the EKC equation. The variables of electricity production and oil production positively affect carbon dioxide emissions, and democracy allows a decrease in greenhouse effects.
The link between economic complexity and climate was investigated by Romero and Gramkow [8] using panel data (fixed effects and GMM-System) for 67 economies considering the period 1976–2012. The empirical results showed that economic complexity and lagged variable of economic complexity reduce greenhouse emissions.
Another important issue is the connection between economic complexity and economic growth (Zhu and Li [17], Dogan et al. [6], Neagu [21], Canh et al. [22]). The empirical research demonstrated that economic complexity is an essential factor in explaining economic growth. These studies found a positive impact of economic complexity on economic growth. For instance, the empirical study of Neagu [21] tested the relationship between the ecological footprint, income per capita, energy consumption, and economic complexity using panel cointegration. This study suggested that energy consumption, economic complexity, and income per capita increase the ecological footprint.
Moreover, Canh et al. [22] considered panel data to evaluate the economic complexity, export diversification, and economic growth cycles for 1996–2014. The results showed bidirectional causality between economic complexity and export diversification. There also exists unidirectional causality between economic complexity and economic growth cycles. However, the authors suggest that the variables of economic complexity and export diversification influence each other.
Testing the role of renewable, non-renewable energy, economic complexity on carbon dioxide emissions, and ecological footprint for the experience of USA was studied by Pata [23] for the period 1980−2016. Considering the equation of carbon dioxide emissions, Pata [23] showed that economic complexity and squared economic complexity are according to EKC assumptions. The variables of globalization and renewable energy promote the improvement of environmental quality. Nevertheless, non-renewable energy increases pollution emissions.
Recently, Ummalla and Goyari [4] considered the Environmental Kuznets Curve (EKC) applied to the BRICS for the period 1992–2014. The authors formulated two equations. The first regression evaluates economic growth, and the second the environmental Kuznets curve, and they used the panel cointegration model FMOLS estimator as an econometric strategy. Regarding only the second regression, we observed that the per capita income and the squared income per capita confirmed the assumptions of the Kuznets environmental curve. The empirical study also suggested that cleaner energy aims to decrease carbon dioxide emissions.
Furthermore, total energy consumption and population, respectively, have a positive and negative impact on CO2 emissions. In this context, the experience of BRICS was considered by Khattak et al. [3]. The authors considered panel data for the period 1980–2016. As explanatory variables, they selected the EKC hypothesis, i.e., U-shaped curve (income per capita and squared income per capita), innovation measured by patents, and renewable energy. Considering the CCEMG estimator, we observe that BRICS countries validate the EKC assumptions. The innovation variable presents a positive effect on CO2 emissions and a negative impact of renewable energy on CO2 emissions. The same tendency is valid for Brazil, China, and Russia; nonetheless, for India and South Africa, the hypotheses of ECK are not valid. In this line, Azevedo et al. [2] considered two groups of countries. The first group is composed of Brazil and Russia. The authors evaluated the impact of the lagged variable of carbon dioxide emissions and income per capita on CO2 emissions. The results showed that in the long run (lagged variable of carbon dioxide emissions) presents a positive effect, indicating that climate change increases and economic growth are positively correlated with carbon dioxide emissions. In the second group, Azevedo et al. [2] showed that lagged variable of carbon dioxide emissions increased, reflecting the environmental damage.
Aziz et al. [24] considered the effects of renewable energy, globalization, and environmental Kuznets curve, using panel cointegration and panel moments of quantile regression for MINT countries cover the period 1995–2018. The authors selected as explanatory variables income per capita, squared income per capita, globalization (KOF index), natural resources, and renewable energy. The econometric results displayed that income per capita and squared income per capita are according to the assumption of the EKC, i.e., a positive and negative effect on carbon dioxide emissions, respectively. The variable of renewable energy is negatively correlated with CO2 emissions proving an environmental improvement. Finally, natural resources and globalization are positively associated with carbon dioxide emissions. In this line, Elshimy and El-Aasar [25] tested the Arabic experience for the period 1980–2014. The authors used the econometric strategy panel cointegration FMOLS–Fully Modified Least Squares, DOLS–Dynamic Ordinary Least Squares, VECM–vector error correction model, Granger causality, and the results demonstrated that income per capita and squared income per capita are according to EKC hypotheses. The variables of bovine meat and non-renewable electricity present a positive effect on carbon footprint. Besides, renewable electricity aims to decrease climate change, i.e., they found a negative relationship between renewable energy and carbon footprint.
The Malaysia experience was investigated by Gill et al. [26]. Considering the arguments of the EKC equation, the authors applied an ARDL model-autoregressive distributed lag for the period 1970–2011, and the econometric results showed that in the long run, the income per capita raises carbon dioxide emissions; however, the squared income per capita is insignificant, and renewable energy is negatively correlated with carbon dioxide emissions, demonstrating that renewable energy decreases climate change and GHG—greenhouse gas.
The interconnection between human capital and EKC was investigated by Hanif et al. [27] for 16 OECD and 14 non-OECD countries for the period 1990–2017. The authors formulated two equations: one for renewable energy as the dependent variable and the other for non-renewable energy. Considering the first equation (renewable energy), human capital and squared human capital are positively and negatively correlated with renewable energy. The innovation and exchange rate are positively associated with renewable energy. Consequently, oil prices present a negative effect on renewable energy.
Testing the impact of renewable energy and the EKC hypothesis in South Korea was considered by Koc and Bulus [28] using the ARDL model. In the long run, the empirical results demonstrated that EKC hypotheses are valid. The variables of renewable energy and trade openness show a decreasing greenhouse emissions and climate change correction. Consequently, energy consumption is positively correlated with carbon dioxide emissions.
The empirical study of Leitão [29] considered the effects of corruption, economic growth, renewable energy, and international trade on CO2 emissions. The author applied panel data for Portugal, Spain, Italy, Ireland, and Greece for 1995–2015. The econometric results demonstrated that economic growth and corruption accelerate carbon dioxide emissions. Nevertheless, international trade and renewable energy presented a negative linkage with CO2 emissions, indicating an improvement in the environment.
3. Materials and Methods
The impacts of economic complexity, economic growth, renewable energy on CO2 emissions are used in this article. The approach considered in this research is panel data for the period 1990–2015, and the sample covers BRICS countries (Brazil, Russia, India, China, and South Africa). The selected period took into account establishing a balanced data panel. Furthermore, the series for the variable of renewable energies is accessible up to 2015.
Before proceeding with the regression model, we applied the panel unit root test Levin- Lin- Chu, Augment Dickey, and Fuller- Fischer, and Phillips -Perron (e.g., Levin et al. [30], Choi [31]) to verify the stationarity of variables considered in this research. This test aims to identify if the variables are stationary at the level or integrated into the first differences.
The panel cointegration between the variables considered, using Pedroni [32,33] and Kao [34], was also considered. These methodologies are intended to observe if the variables are cointegrated in the long run.
Subsequently, we tested the multicollinearity using VIF (variance inflation factor) criterium.
The panel cointegration estimators such as FMOLS (panel fully modified least-squares) and DOLS (panel dynamic least squares) were considered in this research (e.g., Stock and Watson [35], Phillips and Hansen [36]). Furthermore, according to Leitão [29] the models allow analyzing the long-term effects. Therefore, our study can observe the long-term effects of economic growth, renewable energies, the economic complexity index on pollution emissions.
In addition, we compared the results with fixed effects and panel quantile regression. The fixed effects estimator is determined as an average of the pooled OLS estimator, as Wooldridge [37] and Arellano [38] demonstrated. However, the estimator of random effects is determined by covariance. Therefore, when the researchers apply a fixed effects estimator, they should consider the Hausman test. According to the literature (e.g., Arellano [38]; Leitão and Balsalobre-Lorente [39]), the Hausman test considers as a null hypothesis the random effects versus fixed effects, i.e., this test gives information about which estimator is more appropriate if random effects or fixed effects.
Finally, we also consider in the empirical results the panel quantile regression, or the method of moments quantile regression to evaluate and test the heterogeneous effects of EKC (environmental Kuznets curve) as in Koengkan et al. [12], Balsalobre-Lorente et al. [13], and Ike et al. [15]. This methodology allows evaluating the effects of independent variables on the dependent variable through different levels of quantiles.
Hypothesis and Regression Model
The literature review allows us to formulate a set of hypotheses to be tested in the empirical study. Below, we present the hypotheses that are evaluated in the results analysis section:
Hypothesis 1 (H1).
(a) In an initial phase of growth, economic activities cause climate change and consequently carbon dioxide emissions increase; (b) In a development phase, economies acquire an awareness of sustainability; thus, carbon dioxide emissions are expected to decrease.
According to environmental Kuznets curve assumptions, we expect a U-turned curve between income per capita, squared income per capita, and carbon dioxide emissions (CE). Thus, the elasticities of income will be (GDP > 0) and (GDP2 < 0).
The empirical studies of Khattak et al. [3], Ummalla and Goyari [4], and Koc and Bulus [28] also found a positive impact of income per capita (GDP) and negative effect of squared income per capita (GDP2) on carbon dioxide emissions for the experience of BRICS countries.
Hypothesis 2 (H2).
The level of development, innovation, and accumulated productivity make it possible to reduce pollution levels.
ECI (Economic complexity index) is formulated from international trade data, based on the principle of revealed comparative advantages (RCA), in terms of interpretation. So RCAij > 1 means that the country has a comparative advantage (higher economic complexity) and when RCAij < 1 (lower economic complexity). According to the literature (e.g., Romero and Gramkow [8]; Chu [7] Can and Gozgor [5], Dogan et al. [6]), economic complexity aims to improve the environment (ECI < 0).
Hypothesis 3 (H3).
Renewable energy intends to improve the environmental damage.
The recent several empirical studies (e.g., Aziz et al. [24]; Elshimy and El-Aasar [25]; Pata [23]; Aziz et al. [24]; Elshimy and El-Aasar [25]; Leitão [29]) argue that renewable energy is directly associated with sustainable development and the upgrading of air quality.
We expect a negative impact of renewable energy and carbon dioxide emissions (CE) in this context. Therefore, the elasticity of renewable energy is (REW < 0).
Based on the contribution of Can and Gozgor [5], Dogan et al. [6], Chu [7], Romero and Gramkow [8], and Boleti et al. [9], the function assumes the equation:
CE = f (GDP, GDP2, ECI, REW)
LogCEit =
β0 +
β1LogGDPit +
β2LogGDP2it +
β3ECIit +
β4LogREWit + δt +
ηi +
εit
In this research, we use as a dependent variable the logarithm of carbon dioxide emission (CE) in kilotons to estimate the level of pollution, where i represents the BRICS countries, and t signifies the time. Furthermore, δt explains the common determinist trend, ηi signifies the specific effects, and εit represents the random disturbance.
The explanatory variables employed in this study are the following:
LogGDP—represents the logarithm of income per capita expressed in US dollars.
LogGDP2—symbolizes the logarithm of squared income per capita expressed in US dollars.
ECI—signifies the economic complexity index by country.
LogREW—designates the logarithm of a percentage of renewable energy use in total final energy consumption.
Following the contributions of Balsalobre-Lorente et al. [13], Machado and Silva [40], Ike et al. [15], Koengkan et al. [12], the equation assumes the expression 3, when we apply the method of moments quantile regression:
Qy (τ|CEit) = (αi +
δiq(τ)) + Xit′β + Zit′γ q(τ)
The dependent variable is the logarithm of carbon dioxide emissions, i.e., Qy (τ|CEit) indicates the quantile distribution of carbon dioxide emissions (CE), and Xit′ denotes the independent variables of income per capita (LogGDP), squared income per capita (LogGDP2), economic complexity index (ECI), and renewable energy (LogREW). The function (αi + δiq(τ)) reveals the scalar effect (the quantile fixed by the individual in the analysis). Furthermore, the vector of components X is designated by Zt.
In this investigation, we also include the post-estimation test designed by the Wald test. According to this test, it is possible to evaluate the symmetric quantiles, namely the first and third quantiles. However, the empirical studies (Koengkan et al. [12]; Balsalobre-Lorente et al. [13]; Ike et al. [15]; Machado and Silva [40]) demonstrated the regressors are not constant across quantiles.
The variables and sources employed in this investigation are presented in Table 1.
4. Empirical Results and Discussion
This section shows the results to evaluate the environmental Kuznets curve (EKC) and the relationship between economic complexity and carbon dioxide emissions. In addition, the correlation between renewable energy and CO2 emissions is also considered.
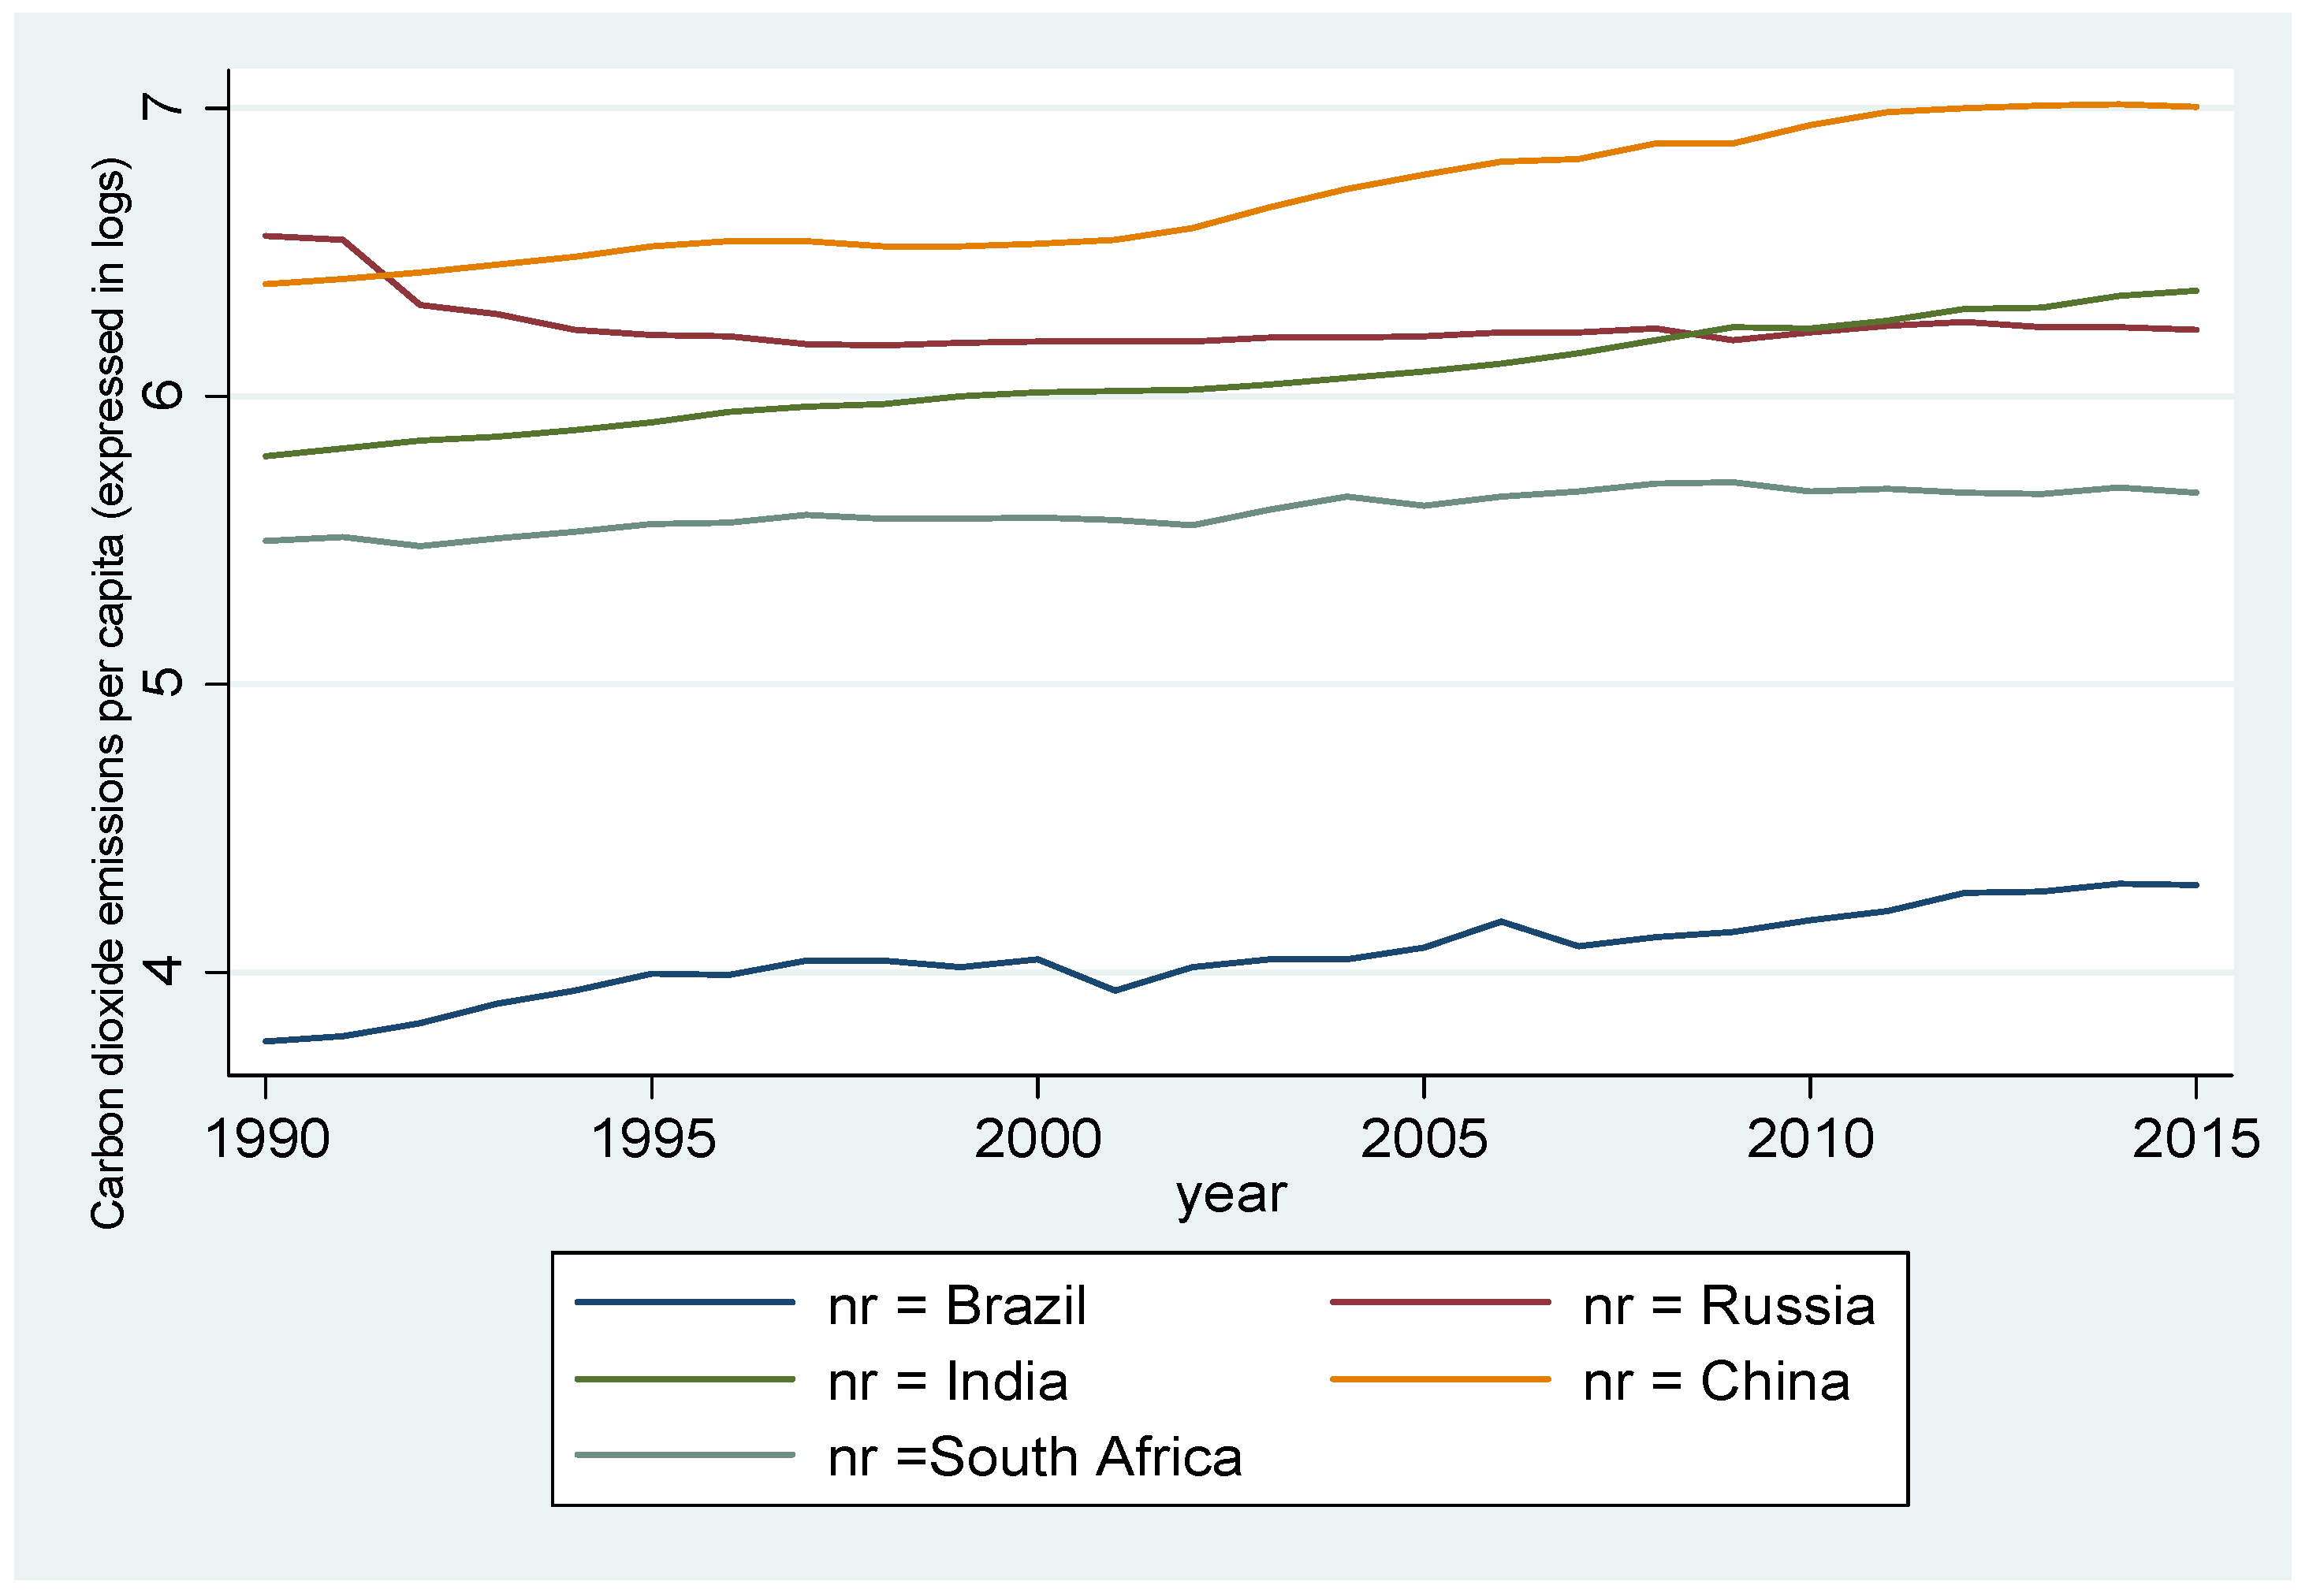
China has the highest levels of carbon dioxide emissions, followed by Russia and India. However, it is observed that Russia has been decreasing pollution levels for the period under review. Of the five countries considered in this study, Brazil has the lowest emission values for carbon dioxide. South Africa has lower values than China, Russia, and China, but these are still high compared to Brazil (Figure 1).
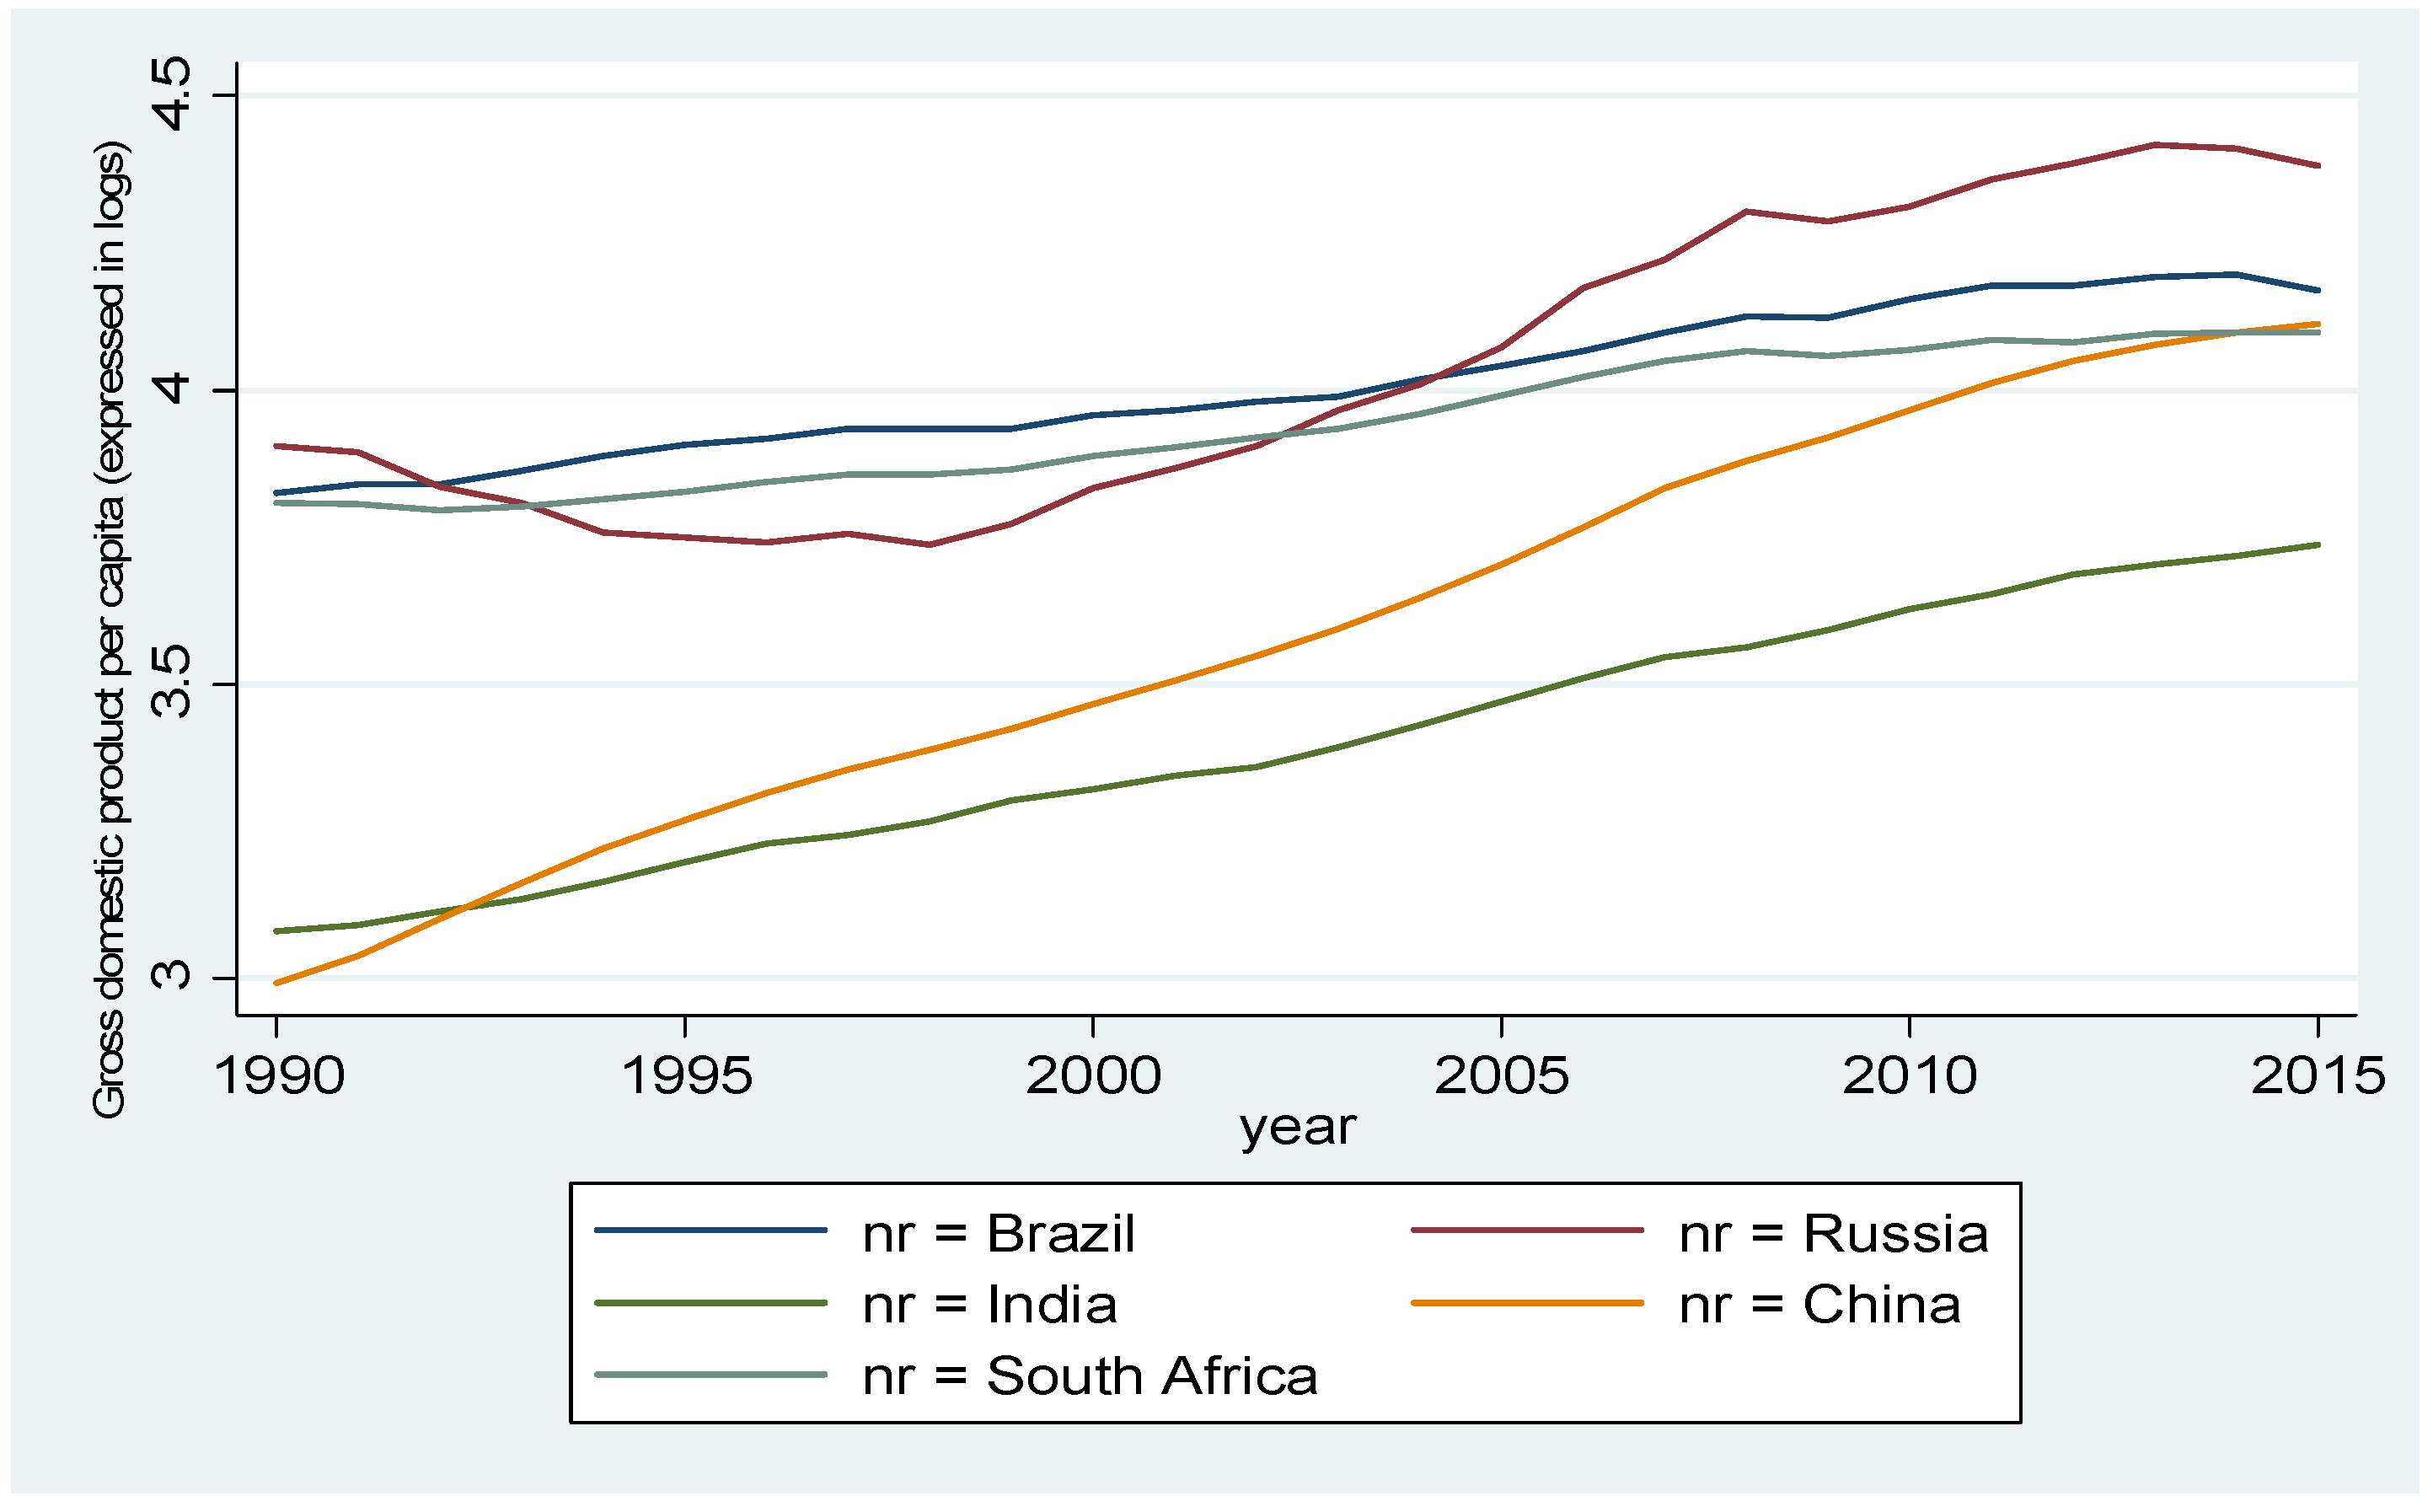
Concerning the distribution of income per capita (GDP), we observe that Russia is in the first ranking since the middle of the 2000s. Brazil and South Africa show one similar tendency. Lastly, China and India present lower GDP values per capita; however, they have a positive slope during the period of analysis (Figure 2).
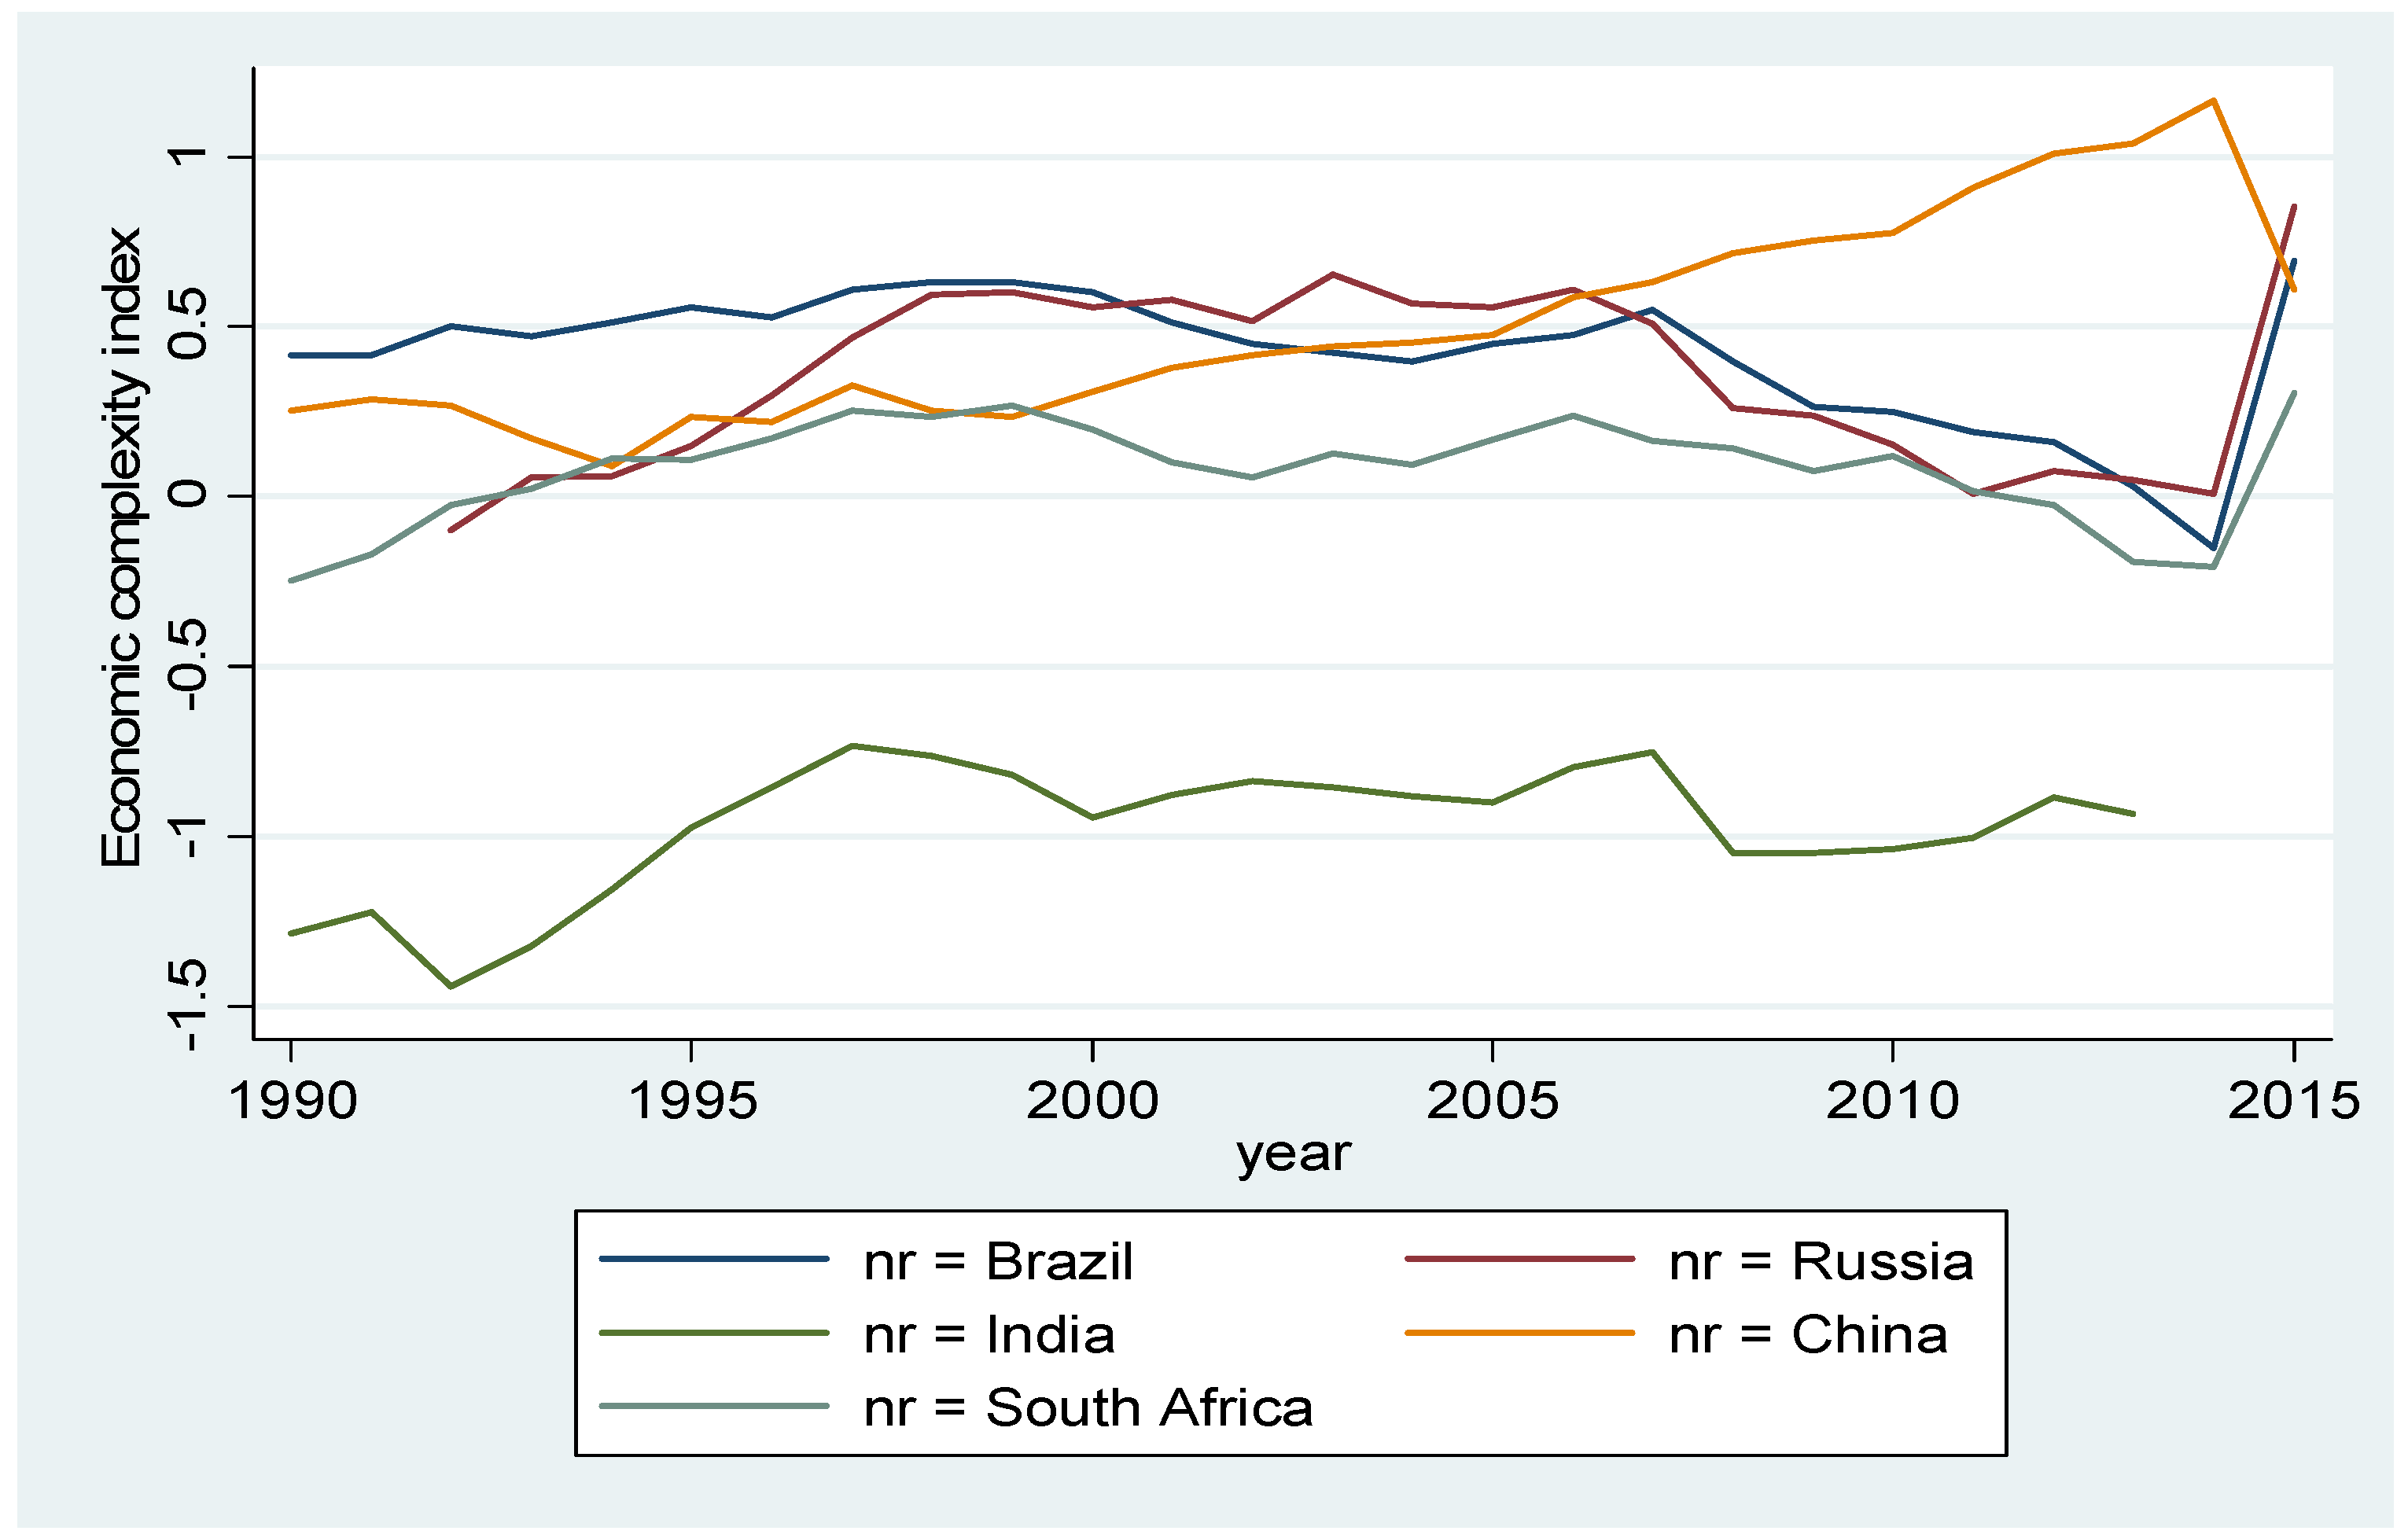
Regarding the economic complexity, we observe that China, Russia, and Brazil present higher values, i.e., these countries have more production capacity and more structure. It is interesting to refer that South Africa is close to these countries. Moreover, it is to conclude that India presents lower values of economic complexity (Figure 3).
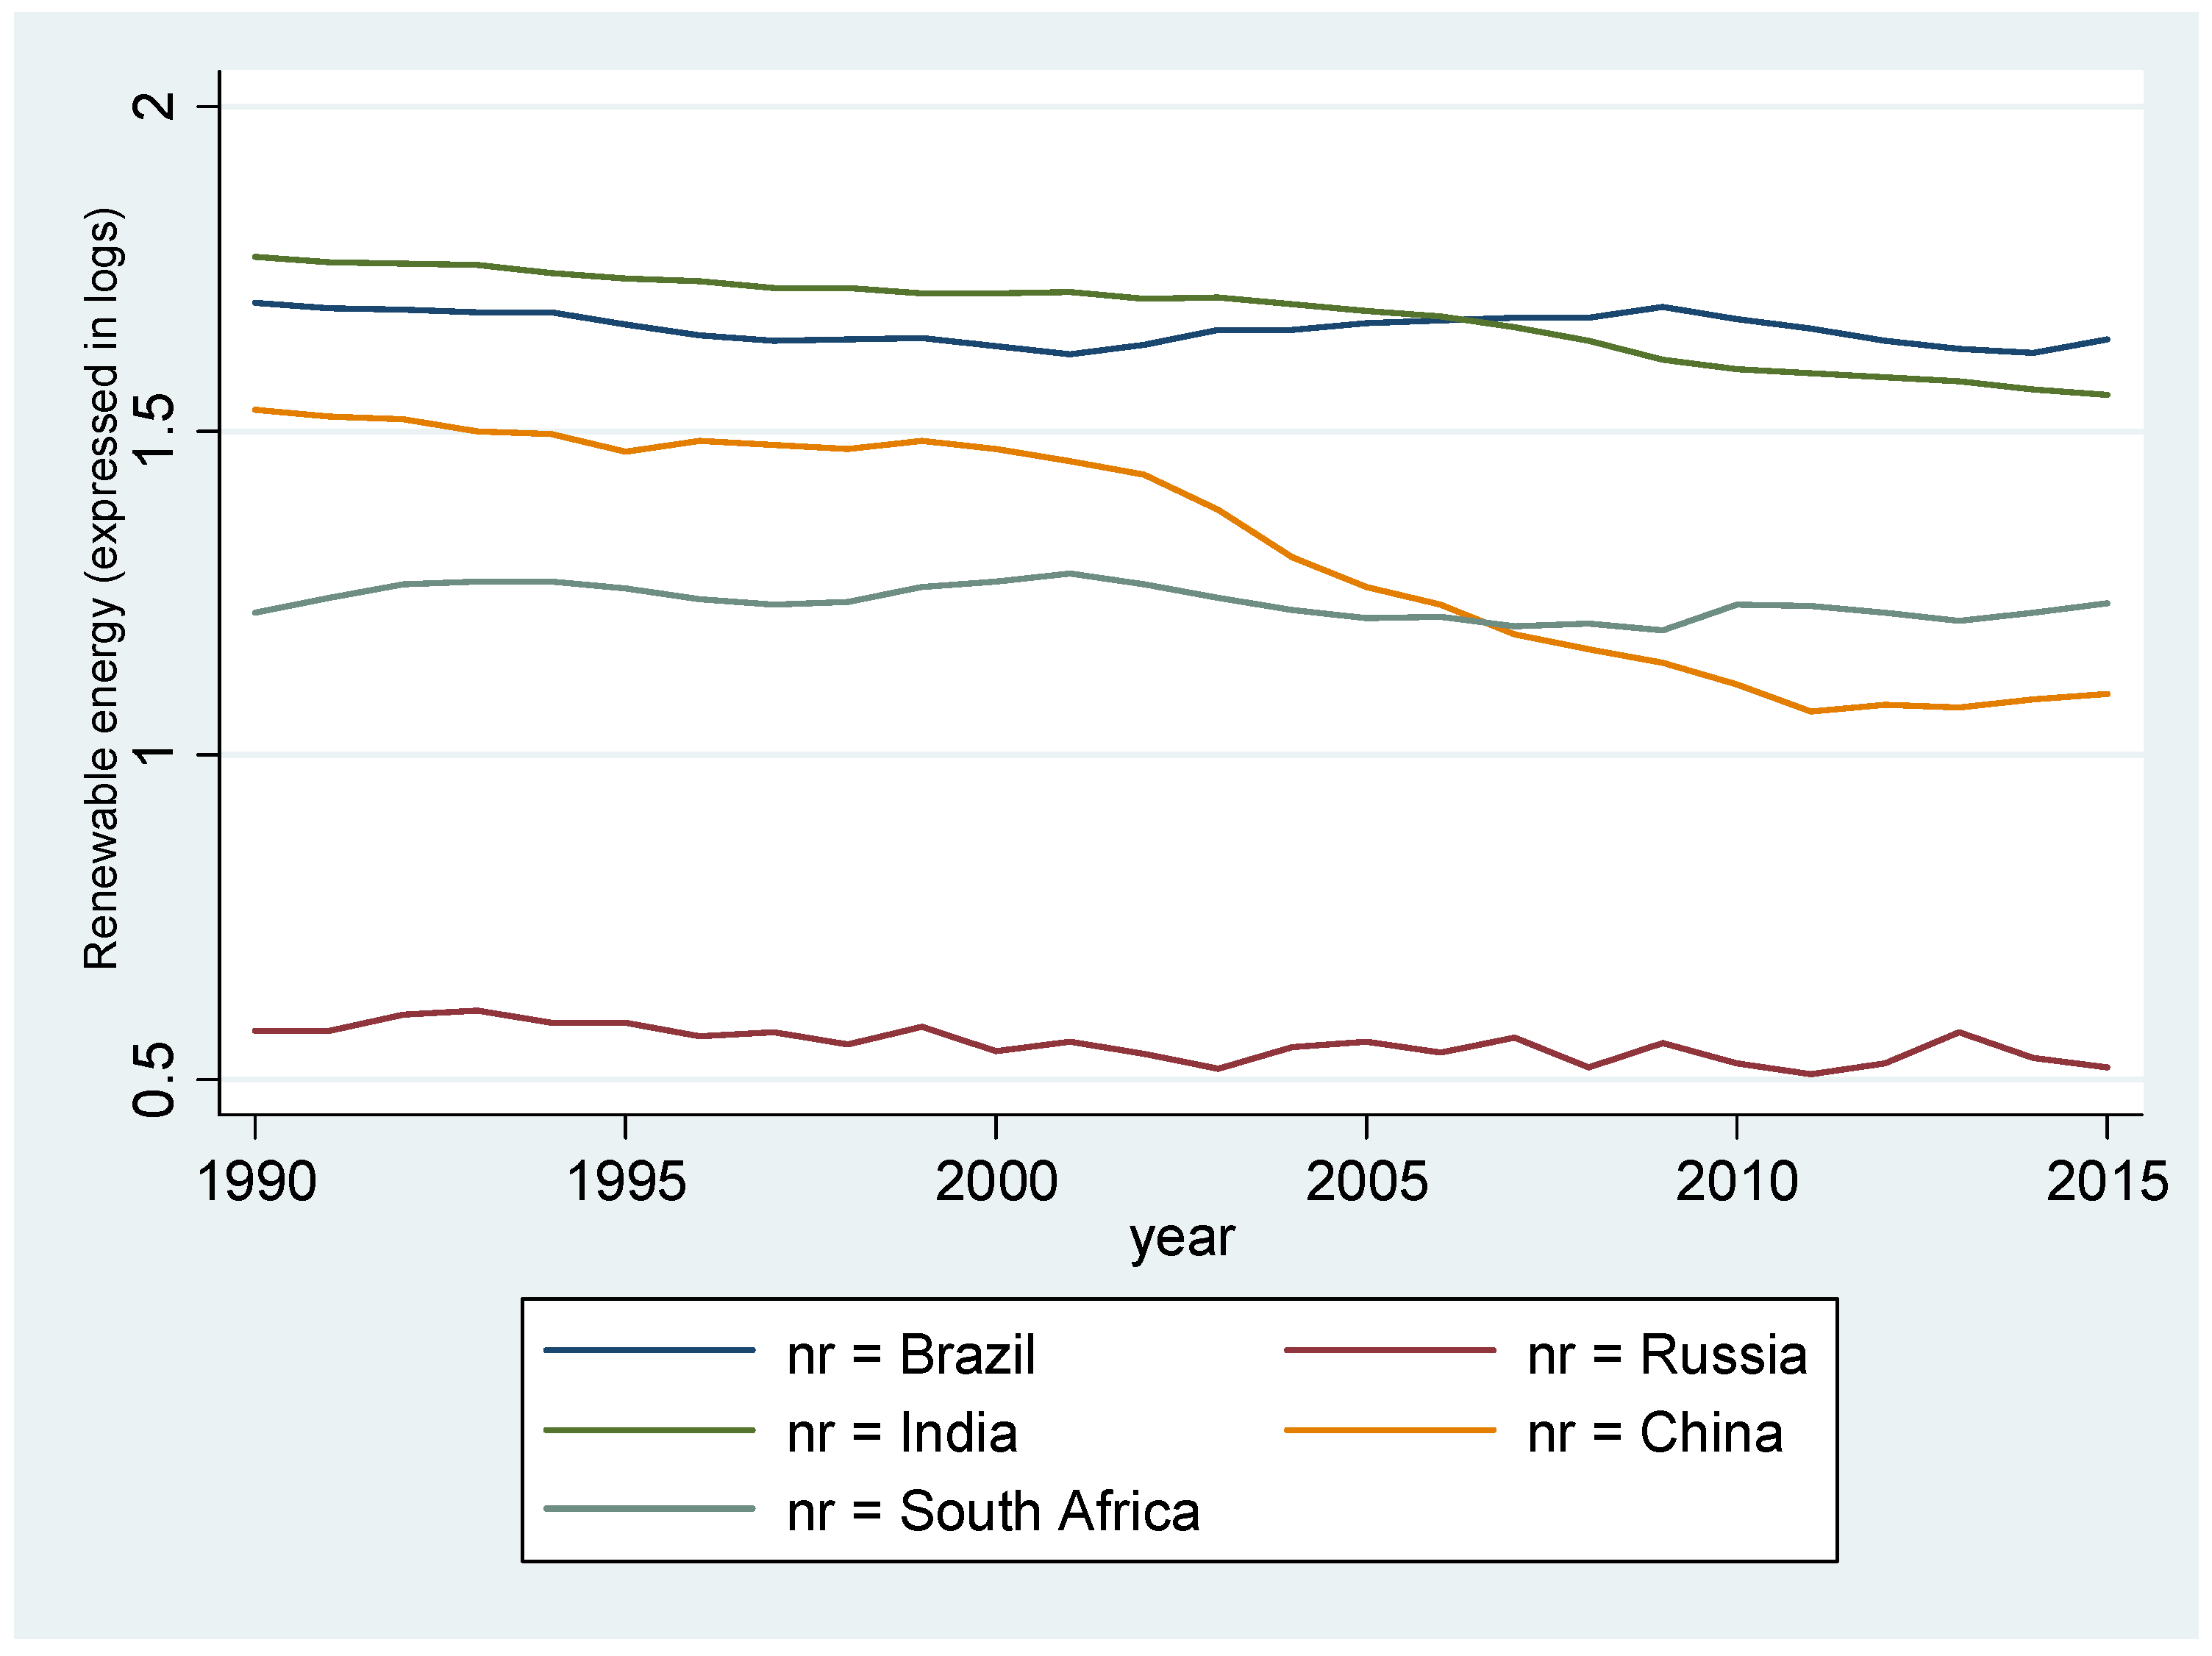
In the countries under analysis, it is possible to observe that Brazil and India lead in renewable energy use. South Africa and China followed. Still, in a developing phase, Russia stands out (Figure 4).
Table 2 gives the general statistics for all variables considered in this study.
In this context, Table 2 reports that the variable of squared income per capita (LogGDP2) and carbon dioxide emissions (LogCE) represent the higher value of Maximum. Moreover, all variables demonstrate a negative skew. The variable of renewable energy (LogREW) indicates the low Kurtosis value, and carbon dioxide emissions (LogCO2) present the low Kurtosis value.
Table 3 presents the results of the panel unit root test considering the arguments of Levin, Lin, and Chu, ADF–Fischer Chi-square, and Phillips–Perron. According to Table 3, the variables of carbon dioxide emissions (LogCO2), income per capita (LogGDP), economic complexity (ECI), and renewable energy (LogREW) are integrated at first difference.
Table 4 reports the test of Pedroni cointegration and Kao residual cointegration test. According to the tests, the variables considered in this research are cointegrated in the long run. Based on the results showed, we observe that there exists cointegration between the variables of income per capita (LogGDP), squared income per capita (LogGDP2), economic complexity (ECI), renewable energy (LogREW), and CO2 emissions (LogCE).
The next step is to assess multicollinearity to see if we can specify econometric models. The studies by Koengkan et al. [12] and Leitão [29] carried out this test before proceeding with the model’s specification. The literature considers no multicollinearity problems when the variance inflation factor (VIF) is less than five. As we observed in Table 5, the variables in this investigation do not present multicollinearity problems.
Table 6 presents the econometric results using the panel fully modified least squares (FMOLS), panel dynamic least squares (DOLS), and fixed effects (FE). The results are similar between the three estimators.
As mentioned in Section 3, the fixed effects model is estimated from a weighted average of the OLS estimator. Thus, it appears that, although the FMOLS estimator and the fixed effects estimator present the same trend, the estimates obtained through the fixed effects are higher for the reasons given.
The coefficients of income per capita (LogGDP), squared income per capita (LogGDP2), and renewable energy (LogREW) are statistically significant at 1% levels. Nevertheless, the economic complexity index (ECI) is statistically significant at a 5% level with FMOLS–panel fully modified least squares, FE–fixed effects, and 1% level with DOLS panel Dynamic Least Squared.
As Leitão [29] refers, the Hausman test compares random effects (RE) versus fixed effects. According to our result, the fixed effects are more sustainable than random effects (e.g., Wooldridge [37]; Arellano [38]; Leitão and Balsalobre-Lorente [39]). Based on the assumptions of EKC, the variables of income per capita and squared income per capita present a positive and negative impact on carbon dioxide emissions (CE). The empirical studies of Khattak et al. [3], Can and Gozgor [5], and Balsalobre-Lorente et al. [13] also found a positive correlation between income per capita and carbon dioxide emissions and a negative impact of squared income per capita and carbon dioxide emissions.
Economic growth and economic activity accentuate environmental problems in an initial stage; however, countries are concerned with environmental issues and improvements (e.g., Balsalobre-Lorente et al. [13]; Leitão and Balsalobre-Lorente [39]). The previous studies of Santana et al. [1], Azevedo et al. [2], Khattak et al. [3], Ummalla and Goyari [4] also found the same tendency for BRICS countries.
Besides, the variables of economic complexity (ECI) and renewable energy (LogREW) are negatively associated with carbon dioxide emissions, illustrating that the structural and innovation of countries and clean energies encourage environmental improvements.
According to the perspective of Hidalgo [16], Zhu and Li [17], and Sweet and Maggio [20], the level of economic development and innovation are factors that contribute to sustainable development. The results that we obtained are in this line. The empirical studies of Dogan et al. [6], Chu [7], Romero and Gramkow [8], and Boleti et al. [9] also found a similar conclusion. On the other hand, renewable energy makes it possible to reduce carbon emissions (EC). According to our estimates, carbon dioxide emissions decrease (−0.708%), (−1.681%), and (−0.642%). The studies by Pata [23]; Aziz et al. [24]; Elshimy and El Aasar [25]; Leitão [29] support our results demonstrating the importance of using clean energy to conserve the environment. The result obtained is still in line with the Kyoto Protocol and Paris Agreement (e.g., Dogan et al. [6]; Leitão [29]; Leitão and Balsalobre-Lorente [39]).
Table 7 shows the empirical results using panel quantiles regression, i.e., the Method of Moments Quantile Regression (MMQR).
The empirical studies of Koengkan et al. [12] and Balsalobre-Lorente et al. [13] suggested that the Wald test aims to interpret proportional quantiles. Concerning the Wald test, we observe that the estimates are not constant across quantiles.
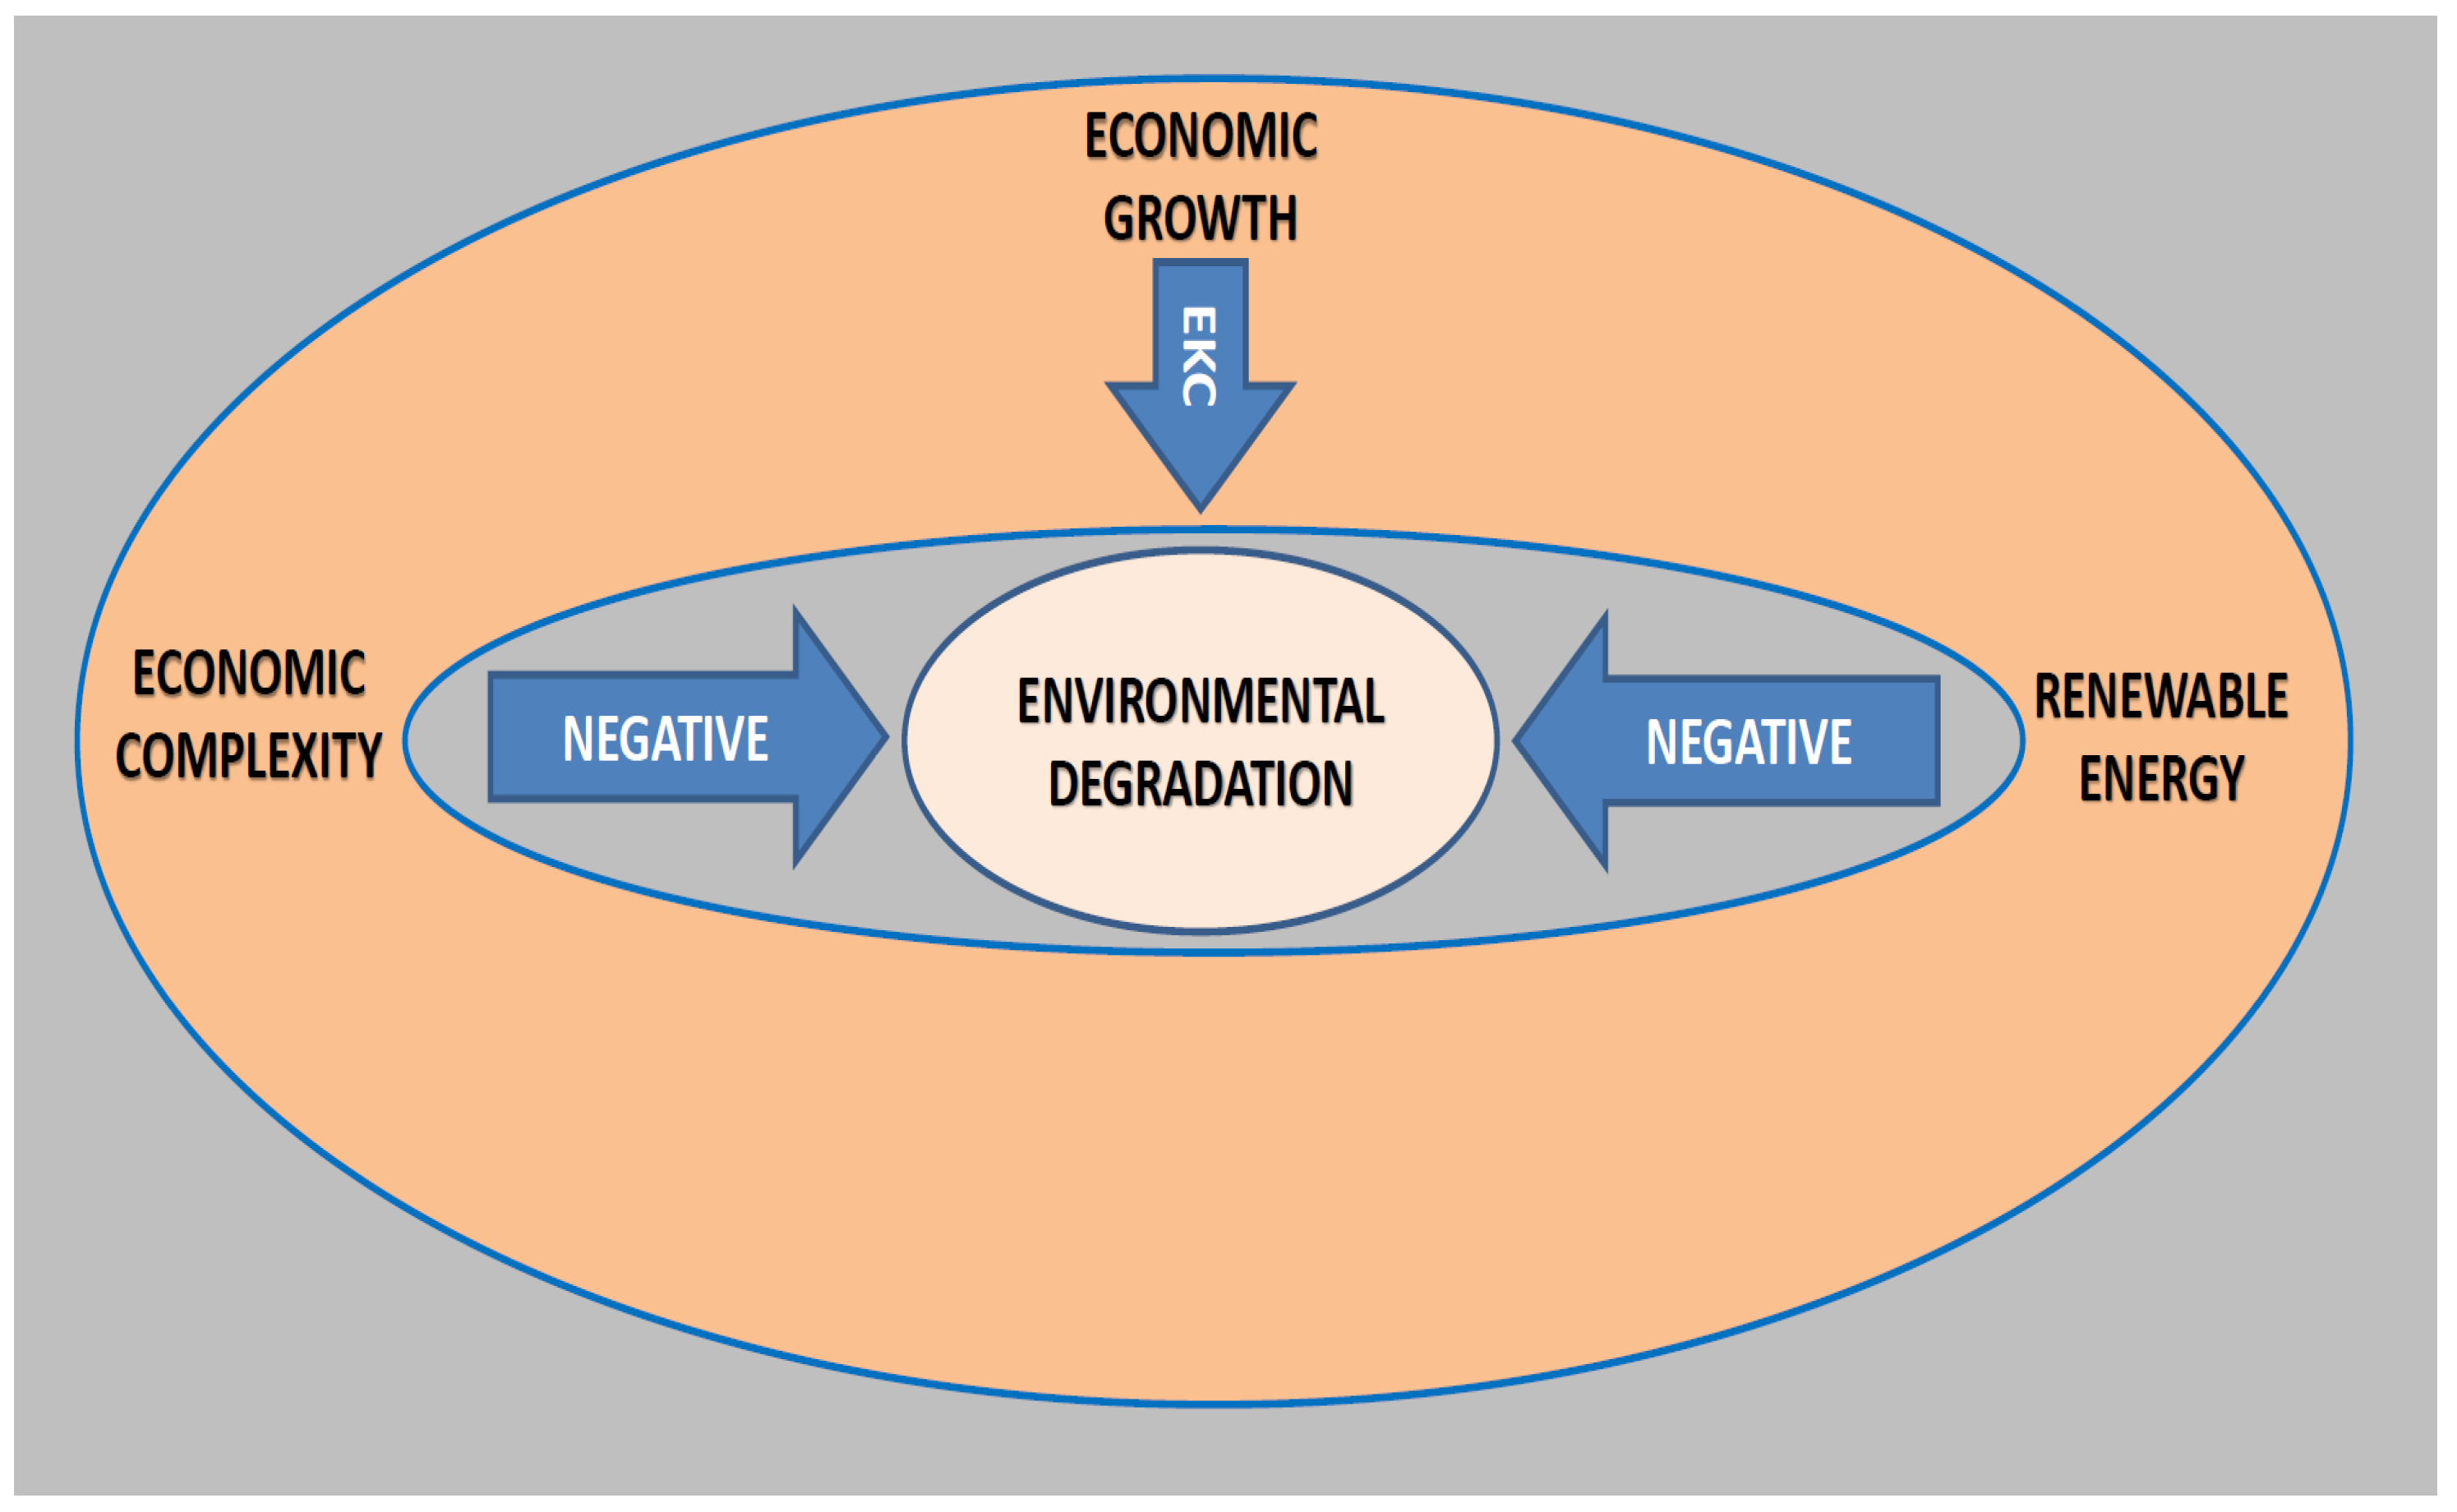
The variables that analyze the classic Kuznets environmental curve (income per capita and squared income per capita) validated hypothesis H1. The coefficients of income per capita (LogGDP) and squared income per capita (LogGDP2) confirm a positive and negative effect on carbon dioxide emissions, and these are statistically significant at a 1% level (Figure 5). The previous studies of Khattak et al. [3], Aziz et al. [24], Elshimy and El-Aasar [25] give support to our result. Further, the economic complexity (ECI) and renewable energy (LogREW) variables are negatively associated with carbon dioxide emissions. These results are according to Can and Gozgor [5], Dogan et al. [6], Chu [7], Romero and Gramkow [8]), i.e., these studies also found a negative correlation between economic complexity and pollution emissions. Furthermore, Balsalobre-Lorente et al. [13], Koc and Bulus [28], and Leitão [29] also demonstrated a negative correlation between renewable energy and CO2 emissions.
5. Conclusions
This investigation assesses the relationships between economic growth, renewable energy, economic complexity, and carbon dioxide emissions applied to the BRICS group of countries (Brazil, Russia, India, China, and South Africa) for 1990–2015. Our choice fell on these countries since these economies are experiencing rapid growth and development (e.g., Azevedo et al. [2], Khattak et al. [3], Ummalla and Goyari [4], and Goldman Sachs [14]). The assumptions of the environmental Kuznets curve are also considered (e.g., Khattak et al. [3], Ummalla and Goyari [4], Balsalobre-Lorente et al. [13], and Koc and Bulus [28]. Also, the impact of the economic complexity index on carbon emissions (EC) allows us to differentiate from previous studies when applied to the BRICS.
The panel unit root test Levin- Lin- Chu, Augment Dickey, and Fuller- Fischer, and Phillips–Perron applied (e.g., Levin et al. [30], Choi [31]) demonstrated that the variables used in this research are integrated into the first differences. When we applied the Pedroni [32,33] and Kao [34] tests to check the cointegration in the long run, we observed that carbon emissions (CE), income per capita (GDP), squared income per capita (GDP2), renewable energy (REW), and economic complexity index (ECI) are cointegrated in the long run.
The econometric methodology applying FMOLS (panel fully modified least-squares) and DOLS (panel dynamic least squares), FE (fixed effects estimator), and the panel quantile regressions revealed that the coefficients present the same tendency between them.
The econometric results obtained demonstrate that the environmental Kuznets curve is valid for the BRICS countries.
Then, the empirical results also indicate that economic complexity and renewable energy present a negative association with carbon emissions (CE). This conclusion is according to previous studies and reveals the improvement of climate change in BRICS.
Furthermore, the results allow us to present some recommendations for policymakers. First, these countries seem to be at a stage of considerable development, so renewable energies and the structures of the economy (economic complexity) make it possible to improve the environment. Therefore, the governments and the government policy of these countries must encourage sustainable practices to verify decarbonization and sustainably achieve economic growth. Consequently, BRICS requires boosting the energy sector and high-tech infrastructures to reduce environmental pressure. It is crucial to refer to the effect of economic complexity and the role of foreign business over economic growth in further research to facilitate additional recommendations for this panel of emerging countries.
In summary, it is pertinent for pragmatic steps to be taken to strengthen environmental and energy regulations in BRICS countries, given the findings from this current study. The promotion of energy technologies is essential to reducing carbon emissions, especially carbon emissions, to achieve the global climate goal targets. Therefore, we consider the need for more efficient and environmentally friendly energy usage as the principal requisite that triggers the paradigm shift from non-renewable energy consumption to renewable energy consumption. Thus, on this premise, the following action directions are rendered for policymakers in BRICS.
In terms of future work, we think it would be interesting to assess the relationship between foreign direct investment (FDI), economic complexity, carbon dioxide emissions, renewable energies, and economic growth applied to the BRICS.
Moreover, we think it will be interesting to test the impact of the structure of productivity and innovation (via economic complexity) on the inputs of foreign direct investment by the BRICS. On the other hand, the resources of these economies and renewable energies may contribute to innovation factors and as positive externalities and sustainable development factors. Another variable that seems essential to us to introduce in future work is democratization since it allows evaluating the development of economies and citizens’ freedom of expression.
Author Contributions
Conceptualization, N.C.L., D.B.-L. and J.M.C.-C.; methodology, N.C.L., D.B.-L. and J.M.C.-C.; software, N.C.L., D.B.-L. and J.M.C.-C.; validation, N.C.L., D.B.-L. and J.M.C.-C.; formal analysis, N.C.L., D.B.-L. and J.M.C.-C.; investigation, N.C.L., D.B.-L. and J.M.C.-C.; resources, N.C.L., D.B.-L. and J.M.C.-C.; data curation, N.C.L., D.B.-L. and J.M.C.-C.; writing—original draft preparation, N.C.L., D.B.-L. and J.M.C.-C.; writing—review and editing, N.C.L., D.B.-L. and J.M.C.-C.; visualization, N.C.L., D.B.-L. and J.M.C.-C.; supervision, N.C.L., D.B.-L. and J.M.C.-C. All authors have read and agreed to the published version of the manuscript.
Funding
This research did not receive any specific grant from funding agencies in public, commercial, or not-for-profit sectors.
Institutional Review Board Statement
Not applicable for studies not involving humans or animals.
Informed Consent Statement
Not applicable for studies not involving humans.
Data Availability Statement
The authors declare that database used is open access World Bank database series (2021) and Atlas Database.
Acknowledgments
Authors’ gratitude is extended to the prospective editor(s) and reviewers that will/have spared time to guide toward a successful publication.
Conflicts of Interest
The authors declare no conflict of interest.
References
- Santana, N.B.; Rebelatto, D.A.N.; Périco, A.E.; Moralles, H.F.; Filho, W.L. Technological innovation for sustainable development: An analysis of different types of impacts for countries in the BRICS and G7 groups. Int. J. Sustain. Dev. World Ecol. 2015, 22, 425–436. [Google Scholar] [CrossRef]
- Azevedo, V.G.; Sartori, S.; Campos, L.M.S. CO2 emissions: A quantitative analysis among the BRICS nations. Renew. Sustain. Energy Rev. 2018, 81, 107–115. [Google Scholar] [CrossRef]
- Khattak, S.I.; Ahmad, M.; Khan, Z.U.; Khan, A. Exploring the impact of innovation, renewable energy consumption, and income on CO2 emissions: New evidence from the BRICS economies. Environ. Sci. Pollut. Res. 2020, 27, 13866–13881. [Google Scholar] [CrossRef]
- Ummalla, M.; Goyari, P. The impact of clean energy consumption on economic growth and CO2 emissions in BRICS countries: Does environmental Kuznets curve exist? J. Public Aff. 2021, 21, e2126. [Google Scholar] [CrossRef]
- Can, M.; Gozgor, G. The impact of economic complexity on carbon emissions: Evidence from France. Environ. Sci. Pollut. Res. 2017, 24, 16364–16370. [Google Scholar] [CrossRef]
- Dogan, B.; Driha, O.M.; Balsalobre-Lorente, D.; Shahzad, U. The mitigating effects of economic complexity and renewable energy on carbon emissions in developed countries. Sustain. Dev. 2020, 1, 1–12. [Google Scholar]
- Chu, L.K. Economic structure and environmental Kuznets curve hypothesis: New evidence from economic complexity. Appl. Econ. Lett. 2020, 28, 612–616. [Google Scholar] [CrossRef]
- Romero, J.P.; Gramkow, C. Economic complexity and greenhouse gas emissions. Word Dev. 2021, 139, 105317. [Google Scholar] [CrossRef]
- Boleti, E.; Garas, A.; Kyriakou, A.; Lapatinas, A. Economic Complexity and Environmental Performance: Evidence from a World Sample. Environ. Model. Assess. 2021, 26, 251–270. [Google Scholar] [CrossRef]
- Leitão, N.C. Testing the Role of Trade on Carbon Dioxide Emissions in Portugal. Economies 2021, 9, 22. [Google Scholar] [CrossRef]
- Leitão, N.C.; Balogh, J.M. The impact of intra-industry trade on carbon dioxide emissions: The case of the European Union. Agric. Econ. 2020, 66, 203–214. [Google Scholar]
- Koengkan, M.; Fuinhas, J.A.; Silva, N. Exploring the capacity of renewable energy consumption to reduce outdoor air pollution death rate in Latin America and the Caribbean region. Environ. Sci. Pollut. Res. 2020, 28, 1656–1674. [Google Scholar] [CrossRef]
- Balsalobre-Lorente, D.; Leitão, N.C.; Bekun, F.V. Fresh Validation of the Low Carbon Development Hypothesis under the EKC Scheme in Portugal, Italy, Greece and Spain. Energies 2021, 14, 250. [Google Scholar] [CrossRef]
- O’Neill, J. Building Better Global Economic BRICs; Global Economics Paper No: 66; Golman Sachs: New York, NY, USA, 2001. [Google Scholar]
- Ike, N.G.; Usman, O.; Sarkodie, S.A. Testing the role of oil production in the environmental Kuznets curve of oil producing countries: New insights from Method of Moments Quantile Regression. Sci. Total Environ. 2020, 711, 13520. [Google Scholar] [CrossRef] [PubMed]
- Hidalgo, C.A. Economic complexity theory and applications. Nat. Rev. Phys. 2021, 3, 92–113. [Google Scholar] [CrossRef]
- Zhu, S.; Li, R. Economic complexity, human capital and economic growth: Empirical research based on cross-country panel data. Appl. Econ. 2016, 49, 3815–3828. [Google Scholar] [CrossRef]
- Hidalgo, C.A.; Hausmann, R. The building blocks of economic complexity. Proc. Natl. Acad. Sci. USA 2009, 106, 10570–10575. [Google Scholar] [CrossRef] [Green Version]
- Felipe, J. Inclusive Growth, Full Employment, and Structural Change: Implications and Policies for Developing Asia; Anthem Press: London, UK, 2012. [Google Scholar]
- Sweet, C.M.; Maggio, D.S.E. Do Stronger Intellectual Property Rights Increase Innovation? World Dev. 2015, 66, 665–677. [Google Scholar] [CrossRef] [Green Version]
- Neagu, O. Economic Complexity and Ecological Footprint: Evidence from the Most Complex Economies in the World. Sustainability 2020, 12, 9031. [Google Scholar] [CrossRef]
- Canh, N.P.; Schinckus, C.; Thanh, S.D. The natural resources rents: Is economic complexity a solution for resource curse? Resour. Policy 2020, 69, 101800. [Google Scholar] [CrossRef]
- Pata, U.K. Renewable and non-renewable energy consumption, economic complexity, CO2 emissions, and ecological footprint in the USA: Testing the EKC hypothesis with a structural break. Environ. Sci. Pollut. Res. 2020, 28, 846–861. [Google Scholar] [CrossRef]
- Aziz, N.; Sharif, A.; Raza, A.; Jermsittiparsert, K. The role of natural resources, globalization, and renewable energy in testing the EKC hypothesis in MINT countries: New evidence from Method of Moments Quantile Regression approach. Environ. Sci. Pollut. Res. 2020, 28, 13454–13468. [Google Scholar] [CrossRef]
- Elshimy, M.; El-Aasar, K.M. Carbon footprint, renewable energy, non-renewable energy, and livestock: Testing the environmental Kuznets curve hypothesis for the Arab world. Environ. Dev. Sustain. 2019, 22, 6985–7012. [Google Scholar] [CrossRef]
- Gill, A.R.A.; Viswanathan, K.K.; Hassan, S. A test of environmental Kuznets curve (EKC) for carbon emission and potential of renewable energy to reduce green house gases (GHG) in Malaysia. Environ. Dev. Sustain. 2018, 20, 1103–1114. [Google Scholar] [CrossRef]
- Hanif, N.; Arshed, N.; Aziz, O. On interaction of the energy: Human capital Kuznets curve? A case for technology innovation. Environ. Dev. Sustain. 2019, 22, 7559–7586. [Google Scholar] [CrossRef]
- Koc, S.; Bulus, G.C. Testing validity of the EKC hypothesis in South Korea: Role of renewable energy and trade openness. Environ. Sci. Pollut. Res. 2020, 27, 29043–29054. [Google Scholar] [CrossRef] [PubMed]
- Leitão, N.C. The effects of corruption, renewable energy, trade and CO2 emissions. Economies 2021, 9, 62. [Google Scholar] [CrossRef]
- Levin, A.; Lin, C.-F.; Chu, C.-S.J. Unit root tests in panel data: Asymptotic and finite-sample properties. J. Econ. 2002, 108, 1–24. [Google Scholar] [CrossRef]
- Choi, I. Unit root tests for panel data. J. Int. Money Financ. 2001, 20, 249–272. [Google Scholar] [CrossRef]
- Pedroni, P. Purchasing Power Parity Tests in Cointegrated Panels. Rev. Econ. Stat. 2001, 83, 727–731. [Google Scholar] [CrossRef] [Green Version]
- Pedroni, P. Panel Cointegration: Asymptotic and Finite Sample Properties of Pooled Time Series Tests with an Application to the Ppp Hypothesis. Econ. Theory 2004, 20, 597–625. [Google Scholar] [CrossRef] [Green Version]
- Kao, C. Spurious regression and residual-based tests for cointegration in panel data. J. Econ. 1999, 90, 1–44. [Google Scholar] [CrossRef]
- Stock, J.H.; Watson, M.W. A Simple Estimator of Cointegrating Vectors in Higher Order Integrated Systems. Economies 1993, 61, 783. [Google Scholar] [CrossRef]
- Phillips, P.C.B.; Hansen, B.E. Statistical Inference in Instrumental Variables Regression with I(1) Processes. Rev. Econ. Stud. 1990, 57, 99–125. [Google Scholar] [CrossRef]
- Wooldridge, J.M. Introductory Econometrics: A Modern Approach, 2nd ed.; South-Western, A Division of Thomson Learning; Oxford University Press: Oxford, UK, 2003. [Google Scholar]
- Arellano, M. Panel Data Econometrics; Oxford University Press: Oxford, UK, 2003. [Google Scholar]
- Leitão, N.C.; Balsalobre-Lorente, D. The Linkage between Economic Growth, Renewable Energy, Tourism, CO2 Emissions, and International Trade: The Evidence for the European Union. Energies 2020, 13, 4838. [Google Scholar] [CrossRef]
- Machado, J.A.F.; Silva, J.M.C.S. Quantiles via moments. J. Econ. 2019, 213, 145–173. [Google Scholar] [CrossRef]
Figure 1.
Panel data distribution of carbon dioxide emissions. Source: Authors’ elaboration based on World Development Indicators (2021).
Figure 1.
Panel data distribution of carbon dioxide emissions. Source: Authors’ elaboration based on World Development Indicators (2021).

Figure 2.
Panel data distribution of income per capita. Source: Authors’ elaboration based on World Development Indicators (2021).
Figure 2.
Panel data distribution of income per capita. Source: Authors’ elaboration based on World Development Indicators (2021).

Figure 3.
Panel data distribution of economic complexity index. Source: Authors’ elaboration based in Atlas Database (2021).
Figure 3.
Panel data distribution of economic complexity index. Source: Authors’ elaboration based in Atlas Database (2021).

Figure 4.
Panel data distribution of renewable energy. Source: Authors’ elaboration based on World Development Indicators (2021).
Figure 4.
Panel data distribution of renewable energy. Source: Authors’ elaboration based on World Development Indicators (2021).

Figure 5.
Graphical scheme. Source: Authors’ elaboration.


Table 1.
Explanation of variables.
| Dependent Variable | Source | |
|---|---|---|
| LogCE—Logarithm of carbon dioxide emissions in kilotons | World Development Indicators (2021) from world bank institution and Carbon Dioxide Information Analysis Center. | |
| Explanatory Variables | Expected Signs | Source |
| LogGDP—Logarithm of income per capita established on purchasing power parity (PPP) | Positive impact on CE | World Development Indicators (2021) from world bank institution and OECD National Account. |
| LogGDP2—Logarithm of squared income per capita established on purchasing power parity (PPP) | Negative impact on CE | World Development Indicators (2021) from world bank institution and OECD National Account. |
| ECI—Economic complex | Negative impact on CE | Atlas Database. |
| LogREW—Logarithm of a percentage of renewable energy use. | Negative impact on CE | World Development Indicators (2021) from world bank institution and OECD National Account. |
Table 2.
Descriptive Statistics.
| Descriptive Statistics | LogCE | LogGDP | LogGDP2 | ECI | LogREW |
|---|---|---|---|---|---|
| Mean | 5.711 | 3.797 | 14.284 | 0.088 | 1.299 |
| Median | 6.016 | 3.859 | 14.512 | 0.234 | 1.406 |
| Maximum | 7.013 | 4.416 | 21.350 | 1.164 | 1.768 |
| Minimum | 3.760 | 2.992 | 7.9057 | −1.442 | 0.508 |
| Std. Dev. | 0.928 | 0.345 | 3.214 | 0.581 | 0.413 |
| Skewness | −0.878 | −0.541 | −0.086 | −0.948 | −0.813 |
| Kurtosis | 2.576 | 2.501 | 2.421 | 3.031 | 2.354 |
| Probability | 0.000 | 0.0 24 | 0.383 | 0.000 | 0.000 |
| Observations | 126 | 126 | 126 | 126 | 126 |
Table 3.
Panel Unit Root Test.
| Variables | Level | First Difference | ||
|---|---|---|---|---|
| Carbon Dioxide Emissions | LogCE | DLogCE | ||
| Method | Statistic | p-value | Statistic | p-value |
| Levin, Lin & Chu t | 3.935 | (1.000) | −7.856 *** | (0.000) |
| ADF—Fisher Chi-square | 2.987 | (0.987) | 63.135 *** | (0.000) |
| PP—Fisher Chi-square | 3.296 | (0.974) | 69.846 *** | (0.000) |
| Income per capita | LogGDP | DLogGDP | ||
| Method | Statistic | p-value | Statistic | p-value |
| Levin, Lin & Chu t | 3.489 | (0.992) | −2.244 ** | (0.012) |
| ADF—Fisher Chi-square | 1.397 | (0.999) | 17.215 * | (0.069) |
| PP—Fisher Chi-square | 0.077 | (1.000) | 20.376 ** | (0.025) |
| Level | First difference | |||
| Economic Complexity | ECI | DECI | ||
| Method | Statistic | p-value | Statistic | p-value |
| Levin, Lin & Chu t | −1.050 | (0.147) | −5.6043 *** | (0.000) |
| ADF—Fisher Chi-square | 11.169 | (0.344) | 43.912 *** | (0.000) |
| PP—Fisher Chi-square | 11.682 | (0.307) | 54.697 *** | (0.000) |
| Level | First difference | |||
| Renewable Energy | LogREW | DLogREW | ||
| Method | Statistic | p-value | Statistic | p-value |
| Levin, Lin & Chu t | −2.275 ** | (0.011) | −4.074 *** | (0.000) |
| ADF—Fisher Chi-square | 15.725 | (0.101) | 47.462 *** | (0.000) |
| PP—Fisher Chi-square | 32.948 *** | (0.000) | 75.539 *** | (0.000) |
*** (1%), ** (5%), and * (10%) significance levels.
Table 4.
Panel Cointegration test of Pedroni and Kao residual cointegration.
| Within-Dimension | |||||
|---|---|---|---|---|---|
| Weighted | |||||
| Statistic | Prob. | Statistic | Prob. | ||
| Panel v-Statistic | 0.257 | (0.080) | −1.128 | (0.870) | |
| Panel rho-Statistic | −0.207 | (0.482) | −0.005 | (0.482) | |
| Panel PP-Statistic | −2.442 *** | (0.007) | −3.702 *** | (0.000) | |
| Panel ADF-Statistic | −1.951 *** | (0.000) | −3886 *** | (0.000) | |
| Between-Dimension | |||||
| Statistic | Prob. | ||||
| Group rho-Statistic | 0.830 | (0.875) | |||
| Group PP-Statistic | −3.517 *** | (0.000) | |||
| Group ADF-Statistic | −3.200 *** | (0.000) | |||
| t-Statistic | Prob. | ||||
| ADF | −2.206 ** | (0.014) | |||
| Residual variance | 0.000710 | ||||
| Heteroskedasticity– and autocorrelation—consistent (HAC) variance | 0.000745 | ||||
*** (1%), and ** (5%) ssignificance levels.
Table 5.
Multicollinearity Test considered OLS estimator.
| Variables | Variance Inflation Factor (VIF) | 1/VIF |
|---|---|---|
| LogGDP | 1.23 | 0.812 |
| ECI | 1.34 | 0.749 |
| LogREW | 1.33 | 0.755 |
| Mean VIF | 1.30 |
Table 6.
Panel Fully Modified Least Squares (FMOLS), Panel Dynamic Least Squared (DOLS), and Fixed Effects (FE).
Table 6.
Panel Fully Modified Least Squares (FMOLS), Panel Dynamic Least Squared (DOLS), and Fixed Effects (FE).
| Variables | FMOLS | DOLS | Fixed Effects |
|---|---|---|---|
| LogGDP | Coef. | Coef. | Coef. |
| 1.080 *** | 1.471 *** | 2.214 *** | |
| (0.000) | (0.007) | (0.000) | |
| LogGDP2 | −0.076 *** | −0.130 *** | −0.204 *** |
| (0.000) | (0.006) | (0.000) | |
| ECI | −0.119 ** | −0.227 *** | −0.216 ** |
| (0.018) | (0.000) | (0.016) | |
| LogREW | −0.708 *** (0.002) | −1.681 *** (0.000) | −0.642 *** (0.004) |
| Constant | 1.077 *** (0.000) | ||
| Observations | 121 | 111 | 126 |
| Adj R2 | 0.389 | ||
| Hausman Test: Chi-Sq. Statistics (4) = | 214.275 *** |
*** (1%), and ** (5%) significance levels.
Table 7.
Panel Quantiles Regression.
| Variables | Quantile 25th | Quantile 50th | Quantile 75th |
|---|---|---|---|
| LogGDP | Coef. | Coef. | Coef. |
| 3.607 *** | 4.387 *** | 5.594 *** | |
| (0.000) | (0.000) | (0.000) | |
| LogGDP2 | −0.415 *** | −0. 579 *** | −0.820 *** |
| (0.000) | (0.000) | (0.000) | |
| ECI | −1.234 *** | −0.849 *** | −0.069 ** |
| (0.000) | (0.006) | (0.577) | |
| LogREW | −1.880 *** (0.000) | −2.088 *** (0.000) | −2.561 *** (0.000) |
| Observations | 126 | 126 | 126 |
| Wald test | 0.230 (0.994) | 0.230 (0.994) | 0.230 (0.994) |
*** (1%), and ** (5%) significance levels.
Publisher’s Note: MDPI stays neutral with regard to jurisdictional claims in published maps and institutional affiliations. |
© 2021 by the authors. Licensee MDPI, Basel, Switzerland. This article is an open access article distributed under the terms and conditions of the Creative Commons Attribution (CC BY) license (https://creativecommons.org/licenses/by/4.0/).
Share and Cite
MDPI and ACS Style
Leitão, N.C.; Balsalobre-Lorente, D.; Cantos-Cantos, J.M. The Impact of Renewable Energy and Economic Complexity on Carbon Emissions in BRICS Countries under the EKC Scheme. Energies 2021, 14, 4908. https://doi.org/10.3390/en14164908
AMA Style
Leitão NC, Balsalobre-Lorente D, Cantos-Cantos JM. The Impact of Renewable Energy and Economic Complexity on Carbon Emissions in BRICS Countries under the EKC Scheme. Energies. 2021; 14(16):4908. https://doi.org/10.3390/en14164908
Chicago/Turabian StyleLeitão, Nuno Carlos, Daniel Balsalobre-Lorente, and José María Cantos-Cantos. 2021. "The Impact of Renewable Energy and Economic Complexity on Carbon Emissions in BRICS Countries under the EKC Scheme" Energies 14, no. 16: 4908. https://doi.org/10.3390/en14164908
Note that from the first issue of 2016, this journal uses article numbers instead of page numbers. See further details here.